The September 2014 issue of the US Navy Institute Proceedings had a one page article named “The Biggest Oil-Spill Culprit? Mother Nature”.
This article indicates that the sources of oil pollution in the ocean can be divided as follows:
Air pollution 4.2%
Run off 11%
Transportation Accidental Spills 9.8% (Marine)
Transportation normal operation 24.1% (Marine )
Natural Oil Seeps 47.3%
Extraction of Petroleum 2.9%
Jettisoned Fuel 0.6%
The article has a nice looking graphic and it provided me a chance to ponder this data.

In looking at this, most oil pollution occurs on the ocean. Air and land initiated pollution accounts for only 16%. This seems low to me. Mostly because non-point pollution is so difficult to capture and the world’s coastlines are very, very, long with the majority of the world’s population living near the coasts.
That made me wonder as to where this data came from, and I called in our present intern Jose Ramirez. It would be a perfect high school intern job to perform a little detective work on this graphic.
Jose performed a tremendous amount of sleuthing in trying to establish the source of the data and this information is provided below.
Since the story is long, I will provide the conclusion first:
There is no reliable quantitative data on ocean pollution, even in order of magnitude estimates, and don’t believe any estimates unless you have been provided solid data
The above graphics represents a mishmash of data that is no more recent than the year 2001 and actually is an average of data going back as far as the 1970’s. As such, it is disturbing that there is a 2015 article that references a graphic based on a 2003 report that is no better than orders of magnitude correct. So who is at fault here? The scientists attempting to make an estimate of oil polution in 2003? The fact that there is no more accurate more recent information? Or that authors recklessly cite inaccurate 2003 research results in a 2015 article on a subject that is in rapid flux.
Bottom line:
With regard to quantifying oil pollution in the oceans we are groping in the dark.
So this is Jose Ramirez’ search for truth:
The graphic did list the source: Woods Hole Oceanic Institution, Jack Cook.
This is where Jose’s trail started and then it became progressively less defined.
Mr. Cook never replied to Jose, but WHOI provided a reference to a 2003 paper on natural oil seeps, that attempted to provide an estimate on oil seep volumes.
Estimating oil seep volumes inherently is a difficult thing to do, but the paper did provide a number. The best estimate is 600,000 metric tons per year with an estimate range from 200,000 to 2,000,000 metric tons per year. Yes, that is an order of magnitude estimate range.
The paper did not provide any data on other pollution sources, but the paper did have an extensive reference listing, and Jose started hunting those references down.
The most useful (and used) reference was “Oil in the Sea III” by the National Academy of Sciences. This is a 2003 paper that used data ranging from 1971 up to 2001. (Jose did not find a more recent Oil in the Sea study) This paper did not provide any measurement data, but rather provides an estimate based on an assumed percentage of vessels that did not comply with MARPOL regulations and then assumed a certain level of illegal discharge and multiplied it by the number of vessel in the world trade. This study arrived at a total discharge volume of 270,000 metric tons, with a range from 90,000 to 810,000 metric tons (again an order of magnitude range estimate). The biggest proportion of this pollution is assumed to be caused by illegal discharge of fuel sludge.
 At this stage it becomes apparent that there is no reliable data about operational discharge even though it has the imprimatur of the National Academy of Sciences.
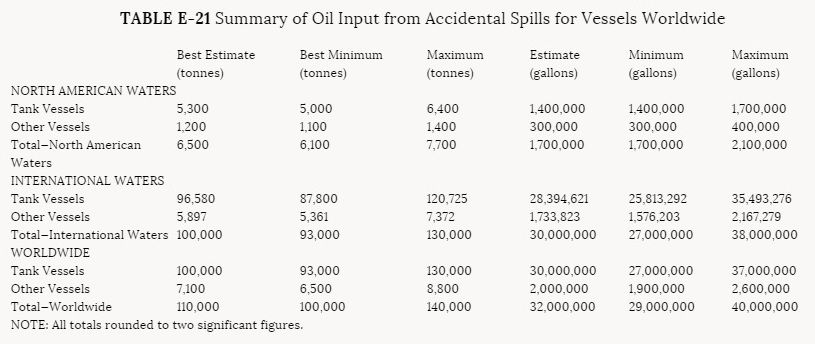
This paper also provides data on accidental spills. The paper could not refer to international oil spill data because in 1999 international oil spills were not closely monitored. However, North American oil spills had been closely monitored for years and showed a very significant downward trend (with a big Exxon Valdez spike in 1989). In 1999 about 800 metric tons was spilled in North American waters , and for the period 1990 to 1999 the average was 4,937 metric tons, with a very significant downward trend.
 After some serious data mulching, the report estimates that average annual accidental oil spills in the world amounts to 110,000 metric tons per year. While this estimate starts with North American data, its extension to the world is almost completely arbitrary.
 This paper also makes an estimate of aircraft fuel dumped (it basically ignores uncombusted fuel from jet engines) This estimate arrives at an annual aircraft fuel dump total of 7,500 metric tons per year. This estimate actually uses old data, but assumes a steady decrease, but still this estimate is actually higher than the recorded oil spill per year in the world (although only North America recorded them) at 4,937 metric tons per year.
The same paper also makes an estimate of land based sources into the sea. This calculation starts with measured hydrocarbon loads in major US rivers by the EPA and then extends this estimate to the world. Remarkably this method provides a range of 6,800 to 5,000,000 tons per year and the paper provides a best estimate of 141,000 metric tons per year.
 Of all the estimates this one actually is the most bizarre, but let’s look on the bright side, this, like all the other discharges except for oil seeps, is on a reducing trend.
There still is the extraction of petroleum and air pollution, but Jose could not find any specific references for these estimates. Regardless we can assume it is at least as messy as the other estimates. As an example, one can use the Deepwater Horizon as a data point. This spill occurred in 2010 and the volume spilled is reported at 668,000 metric tons. We cannot assume that there is a spill like this every year, but let’s use the National Academy of Science method and take this one oil spill and assume it is the only North American spill in a decade so we divide it by 10, which results in 69,000 metric tons per year in North America, using the NAS multiplier to convert to worldwide extraction spills (110,000/4,937) this would convert to 1,500,000 metric tons per year spilled due to extraction of petroleum.
In other words this very reasonable “estimate” using the latest data shows that oil extractions is by far the biggest polluter of our oceans. Is this true? Most probably not. It is just a very rough estimate just like the other estimates produced by the scientific community.
So what do we know about pollution into the oceans? Actually very little, but some things are pretty clear. Old bad data is very difficult to get out of the system.
Meanwhile, I will provide this estimate: Overall ocean pollution caused by maritime transport is tiny compared to other pollution sources and it is time that the world takes a closer look at it.
The graphic that I saw in the September 2014 issue of Proceeding is based on data from the 70’s, 80’s and 90’s. Everything with regard to oil pollution has gotten better since then, except oil seepage which we cannot control, but is oil natural seepage the biggest problem today? That is hard to say since the land runoff estimate and the extraction estimates have orders of magnitude uncertainties and may very well still be a bigger threat to the environment.